


Idea: The Histogram as the Image
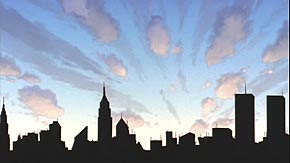
 Yesterday, I posted the image seen here and told you that there is another picture hidden somewhere within it. I challenged my readers to find it. After a bit of confusion in the comments, someone finally declared that they found it: “Hahahaha! Cool! It’s the NY skyline!” Another reader noted, “The first thing I did was to try to tweak the image using the Levels command. I was greeted with a surprise right there in the dialog.”
Yes, the New York City skyline is hidden in that picture’s histogram. It looks like this:
Several people have asked how I did it. So I’ll explain, but I might get a little longwinded in my attempt to be clear. Feel free to just skim and look at the pictures if you don’t want to read it all.
The idea for this project started with a question: Is it possible to create an image that depicts its own histogram? (A histogram, for those unfamiliar with the term, is a bar graph representing all the tones in an image — it typically looks something like a mountain range). I played around a little bit in Photoshop and the closest thing I came up with was this image:

…which has this histogram:

Yeah, okay. That was neat I guess. But I couldn’t come up with any other shapes that worked. But all this thinking about histograms and what they represent got me wondering if I could control what a histogram looks like by manipulating the image. Could I create something recognizable? To try it, I would need to find something that would be entirely black, horizontal in orientation, and not require any holes or vertical gaps. A skyline seemed perfect.
I did a Google Image Search for “manhattan skyline silhouette” and was tickled to see that the perfect image came up in a result from my own site! I once posted an entry about New York City as depicted in the animated film Antz. Google showed me this image from that entry on the first page of search results:
A typical 8-bit grayscale image can have 256 possible shades of gray. A histogram represents the amount of pixels at each level from 0 to 255, and is 256 pixels wide. So the first thing I did was shrink down the Antz skyline to 256 pixels wide. This meant that each vertical band of black pixels in the skyline represented a value from 0 (black) to 255 (white).
Then I created a new document. The first column of pixels in the skyline image represents value “0” and has 43 black pixels. So my new document needed 43 pixels with the value “0.” Column 2 of my skyline represents value “1” and has 46 black pixels. So my new document needed 46 pixels with the value “1.” And so forth.
Another way to think of it is to say that I took all of the “skyline” pixels from this image:

…and put them in a new document, with no other pixels. Then I rearranged all those pixels into a square from dark to light. The result was very close to perfect. The histogram looked pretty much like the skyline, but it was stretched vertically.
Normally, a histogram is scaled vertically so that whatever value has the most pixels reaches all the way to the top of the graph, and everything else is sized proportionately. In this case, it is the shade of gray which forms the World Trade Center antenna that has the most pixels. So this is roughly what the histogram looked like:

I was thrilled that it worked, but I didn’t want it stretched vertically like that. In order to prevent the WTC tower from being too tall (and everything else scaling upwards with it) I had to put extra pixels of one value in my image, so there would be more pure of that value than any other value, which would push the others down so that the graph remains proportionate. I chose pure white, because this creates a thin black line at the far right side of the histogram where you don’t notice it.
I could have added this row of white pixels at the bottom of the new image, but instead I typed my website name in white, and placed it within the image. In doing so, I copied over some other pixels, which altered the skyline. So I had to put it in a place where the “damage” to those buildings wouldn’t be that noticeable. It took trial and error, but I found a good spot. It changed the skyline on the left side a little bit (compare to the “Antz” image). But it still looks like buildings, so I accepted it. Also, this way I get some credit if the image gets passed around without attribution.
I did it all tediously by hand, but I think with a little tinkering, someone could write a program to simplify the process, taking a 256 x 100 silhouetted image and extrapolating a new image with that as the histogram. And the final image file doesn’t need to be a square with a gradient, either. Those pixels could be in any order. They could be completely scrambled. Or they could be laid out in a way that shows an image of an Apple (as in “The Big Apple”). As long as no new pixels are introduced or deleted, the histogram remains the same. But that is a lot more work than I was prepared to do.
Oh, I almost forgot: I doubled the image size so it would look a little better on the website. As long as I resized it using the “Nearest Neighbor” method instead of some other interpolation method, every pixel (and therefore every shade represented in the image) would be duplicated identically, keeping the proportions in the histogram the same.
Update: A reader has taken this idea even further!

Comments
That’s a very cool idea
Posted by: Ben Rowe | September 27, 2007 3:03 AM
THe first thing I thought it might be was a method I used myself a few years ago when I was playing with possibly obscure steganographic methods. I’ve linked in the URL an image I made showing what I came up with. It’s a totally different method to yours…
It should work correctly in all modern browsers… however older browsers may display the ‘hidden’ image in preference to the ‘correct’ one. The image is a standard .png format.
Posted by: Nemo | September 27, 2007 3:39 AM
Oh!, that was clever thinking… :-)
I think I’ll give it a try.
Posted by: Demian | September 27, 2007 5:09 AM
Wow! First of all kudos for this amazing idea.
Secondly: No wonder I didn’t see it… the free image editing software I used to tweak it (on my other computer for which I have no Photoshop license) displays the histogram like this:
http://tinyurl.com/276zam
I guess close but no cigar, eh?
Posted by: Peter Marquardt | September 27, 2007 6:06 AM
Self-referentiality rules!! :D
Posted by: marcomastri | September 27, 2007 7:51 AM
“I think with a little tinkering, someone could write a program to simplify the process”
That sounds like a challenge to me. I might try to whip something up in .NET if I get a chance.
Posted by: Rockwell | September 27, 2007 12:11 PM
I haven’t taken the (presumably large amount of) time necessary to really try this out yet… but theoretically you could make more complex images using something like red histogram minus green histogram plus blue histogram = image. You could start by having three images that you essentially stack vertically or horizontally (although you’d have to cancel out some overlap, now that I think about it), but in theory you could “compress” that information by combining pixels (you don’t need a 255,0,0 pixel and a 0,255,0 pixel if you have a 255,255,0 pixel, for example). That is, assuming I understand how the histogram channels work.
Posted by: Jon the Geek | September 27, 2007 3:23 PM
Then this will blow your mind:
http://www.bastwood.com/aphex.php
Posted by: Link | September 27, 2007 3:57 PM
Fourier transform?
Posted by: Dan | September 27, 2007 4:12 PM
that is awesome! good job!
Posted by: mark | September 27, 2007 4:13 PM
My head hurts.
Posted by: Beerzie Boy | September 27, 2007 4:19 PM
Hey, Link: I definitely had the Aphex Twin spectograph in mind when I did this. I meant to reference it in my post, but totally forgot. Thanks for filling in the oversight!
Posted by: David | September 27, 2007 4:24 PM
You could rearrange the pixels in the rectangle into something resembling the NY skyline, but still maintain the NY skyline histogram.
Posted by: Rafe | September 27, 2007 4:32 PM
Bah. Anyone can hide images in other images, but it takes real talent to hide video in sound.
http://www.youtube.com/watch?v=s1eNjUgaB-g
and
http://www.vinylvideo.com/
Posted by: John Laur | September 27, 2007 5:02 PM
Neat! I never heard of the term histogram before so now I know.
Aloha!
Posted by: Alexisnexus | September 27, 2007 5:11 PM
Have some respect idiot. WTC is gone and so is the lives of 5000 thousand people. You don´t have to remind it all the time.
Posted by: Marcos Gonzalez | September 27, 2007 5:56 PM
Because the best way to honor the dead is to pretend it didn’t happen?
Also, the accepted number of deaths in the WTC collapses is 2,993, including the 19 hijackers. Not that exaggerating that much makes people write you off as an idiot and ignore what you’re saying or anything. Except it does.
Posted by: Will | September 27, 2007 6:15 PM
@ Gonzales:
Oh man, you’re right! We’d better go destroy every image of New York taken between the late seventies and 2001. Wouldn’t want to offend anyone! Go troll somewhere else, asshat.
Posted by: Andrew | September 27, 2007 6:41 PM
Try using a gaussian for your histogram image
Posted by: D | September 27, 2007 6:54 PM
Ask and ye shall receive. My very basic automated script:
Upload a 256x100 png file and it’ll give you the gradient-style image which has your original picture encoded into the histogram.
http://fisher.spadgos.com/histo
Posted by: nickf | September 27, 2007 7:48 PM
Great job! I love those pointless, tedious and nerdly amazing works.
Posted by: Pedro Estarque | September 27, 2007 11:22 PM
Great job! I love those pointless, tedious and nerdly amazing works.
Posted by: Pedro Estarque | September 27, 2007 11:24 PM
Thanks pedro!
Posted by: nickf | September 28, 2007 1:18 AM
Too much time on your hands?
Posted by: Bob | September 28, 2007 1:43 AM
Aw, not really - it’s a pretty simple 50-line php script. One thing I was thinking about, though, was trying to make the output image more interesting, rather than just a plain gradient. Randomising the output order of the colours just made some streaky noise patterns which were even less interesting. Could anyone think of a better method?
Posted by: nickf | September 28, 2007 3:10 AM
you could try making the output image match the source image as closely as possible. use the darkest pixels for the bottom and the lightest pixels for the top, and then flip the gradients around so the highest contrast occurs along silhouette edge. just a thought
Posted by: pj | September 28, 2007 6:51 AM
Last year, I published a book of Ansel Adams’s histograms called “New Landscapes”. The book is designed to mimic the form of all those grandiose coffee table photobooks of Adams’s work, and in the histograms I saw the natural forms (peaks, valleys, ranges) of his images. I thought it an interesting meditation on different technologies, considering Adams’s obsession with analog exposure and printing techniques.
You can view a few samples here:
Ansel Adams | New Landscapes
(Visual Studies Workshop Press, 2006)
… and thanks for a great post!
Posted by: Luke Strosnider | September 28, 2007 8:10 AM
Martin Scorcese beat you to it by 5 years:
http://en.wikipedia.org/wiki/Gangs_of_New_York
Posted by: Ellis Vener | September 28, 2007 12:29 PM
nickf: How is the Titanic image a histogram? It seems to have white space below black pixels, which, as I understand histograms, shouldn’t be possible…
Posted by: Jon the Geek | September 28, 2007 4:05 PM
hehe yeah, i hoped no one would notice - i just couldn’t be bothered screencapping the histogram :p - the sample images are the inputs.
Posted by: nickf | September 28, 2007 11:46 PM
In Corel Photopaint the histogram looks like this:
http://vladimir.skach.cz/files/histogram.gif
Posted by: Eso | September 29, 2007 3:11 AM
19 hijackers? Hijackers? I hereby write YOU off as an idiot.
Posted by: Anonymous | September 29, 2007 11:32 AM
Please tell us how long it took you to do this? It surely must have taken a LONG LONG time!
Posted by: JohnnyW | September 29, 2007 12:58 PM
Very original:) great Job
Posted by: Donosti | September 30, 2007 1:25 PM
show the skyline:
————————-
#!/usr/bin/env python2.5
import Image # PIL (Python Imaging Library)
import itertools
import array
import sys
# Usage: i2h.py infile outfile
infile, outfile = sys.argv[1:]
im = Image.open(infile)
h = im.histogram()
# there’s something strange going on with the original gif
#h.append(h.pop(0))
h = [i*100/max(h) for i in h] # normalize
h = [(0,) * (n/8) + (255 >> n%8,) + (255,) * (12-n/8) for n in h]
h = list(itertools.chain(*h)) # flatten
h = array.array(‘B’, h)
hi = Image.frombuffer(‘1’, (100, 256), h, ‘raw’, ‘1’, 0, 1) # -1 for the original
hi.rotate(90).save(outfile)
———————
hide the skyline:
————————-
#!/usr/bin/env python2.5
import Image # PIL (Python Imaging Library)
import itertools
import array
import sys
# Usage: h2i.py infile outfile
infile, outfile = sys.argv[1:]
hi = Image.open(infile)
hi = hi.rotate(270)
s = hi.tostring()
h = [s.count(‘\x00’, i, i+101) for i in range(0, len(s), 100)]
s = “”.join([chr(i) * h[i] for i in range(len(h))])
im = Image.fromstring(‘L’, (80, 122), s)
im.save(outfile)
Posted by: hop | September 30, 2007 4:59 PM
The code for my little PHP script is online too, at http://spadgos.com/?p=19 if anyone’s interested.
Posted by: nickf | October 1, 2007 3:21 AM
Reminds me of the patterns that some old TV engineers would draw on vectorscopes.
Posted by: David Moisan | October 2, 2007 12:22 PM
WAY too geeky. My brain hurts.
Posted by: yellojkt | October 3, 2007 10:02 PM
who can spot the stupid fence error?
Posted by: hop | October 4, 2007 8:32 AM
Hiya, David. I saw this a few days ago and loved it, but couldn’t set down the idea of doing it one better and actually modifying source images to produce histogram-matching output that also looked like, well, not a gradient.
I’ve pulled it off, at least as a proof-of-concept, and I thought you might like to see it.
Cheers,
Josh
Posted by: Josh Millard | October 4, 2007 9:01 PM
What you thought of is awesome, my brain hurts trying to understand how you did this with photoshop, I did try a few thigs with no satisfying result. I tried using cs4 because I like to do things manualy since I don’t know programming. I realy like playing with photoshop, I’m not that good at it, but I think I know the basics :D.
That’s why I would ask for a step by step with images (for idiots like me) if it’s not to much to ask
Posted by: peter | April 22, 2009 2:55 PM
Doesn’t that incude the twin towers????? surely they’ve been gone for years !!!!!!
Posted by: me | June 7, 2010 6:28 PM
Hi, amazing that comment about hiding video in sound!!
Posted by: Steven | April 9, 2011 10:54 AM